
|
|
|
|
Stephan
Bringert
|
|
Stephan
Svensson
|
|

|
|
|
| |
Information |
|
|
|
|
|
|
|
| |
Filter |
|
|
|
|
|
|
|
|
| |
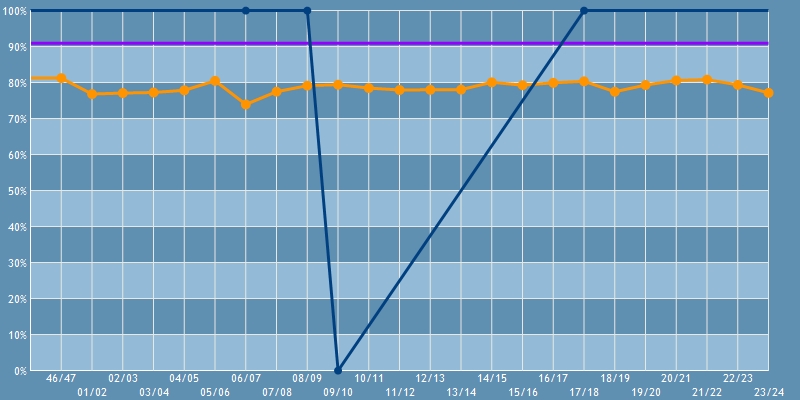
Graph - 5-Set Match. Lost After Trailing 1-2 |
|
|
|
|
|
Percent per season for player
|
|
|
Average percent for player
|
|
|
Average per season for all players
|
|
|
|
|
| |
5-Set Match. Lost After Trailing 1-2 |
|
|
| Total | | 10 out of 11 | 90.91% | | 78.60% | -12.31% |
| 2017/2018 | | | 2 out of 2 | 100.00% | | 90.91% | -9.09% | | 80.37% | -19.63% |
| |  | First Division | | 2 out of 2 | 100.00% | | 90.91% | -9.09% | | 80.08% | -19.92% |
| | | | Regular Season | 2 out of 2 | 100.00% | | 90.91% | -9.09% | | 80.08% | -19.92% |
| 2009/2010 | | | 0 out of 1 | 0.00% | | 90.91% | +90.91% | | 79.44% | +79.44% |
| | | First Division | | 0 out of 1 | 0.00% | | 90.91% | +90.91% | | 78.92% | +78.92% |
| | | | Regular Season | 0 out of 1 | 0.00% | | 90.91% | +90.91% | | 78.92% | +78.92% |
| 2008/2009 | | | 1 out of 1 | 100.00% | | 90.91% | -9.09% | | 79.17% | -20.83% |
| | | First Division | | 1 out of 1 | 100.00% | | 90.91% | -9.09% | | 79.21% | -20.79% |
| | | | Regular Season | 1 out of 1 | 100.00% | | 90.91% | -9.09% | | 79.21% | -20.79% |
| 2006/2007 | | | 7 out of 7 | 100.00% | | 90.91% | -9.09% | | 73.95% | -26.05% |
| | | First Division | | 7 out of 7 | 100.00% | | 90.91% | -9.09% | | 72.06% | -27.94% |
| | | | Regular Season | 7 out of 7 | 100.00% | | 90.91% | -9.09% | | 72.06% | -27.94% |
|
|
|
|